
OPINION | This article contains the author's opinion.
While mainstream media outlets are touting the alleged “success” of Bidenomics, the real data paints a starkly different picture, regardless of whether we’re looking at what Americans are paying, earning, or saving.
The non-profit group Media Research Center has compiled five charts that sum up the economic impact of Joe Biden. It includes:
• Gas prices are up 63%.
• Real wages have gone down for Americans.
• Prices are skyrocketing 3 times faster under Biden.
• Mortgage rates are changing for the worse under Biden.
• Saving rates of Americans have collapsed under Biden.
Here are the charts:
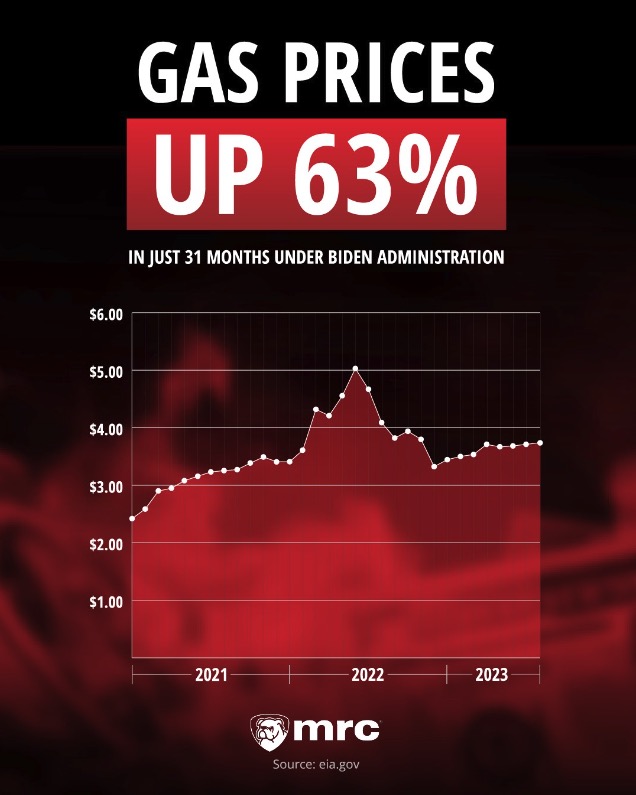
Gas prices, for instance, remained relatively stable during Donald Trump’s presidency, even decreasing by four cents a gallon.
In the first 31 months of Joe Biden’s term, gas prices have surged by a staggering 63%. The average price per gallon of gas has risen from $2.42 to $3.95, as reported by the U.S. Energy Information Administration.
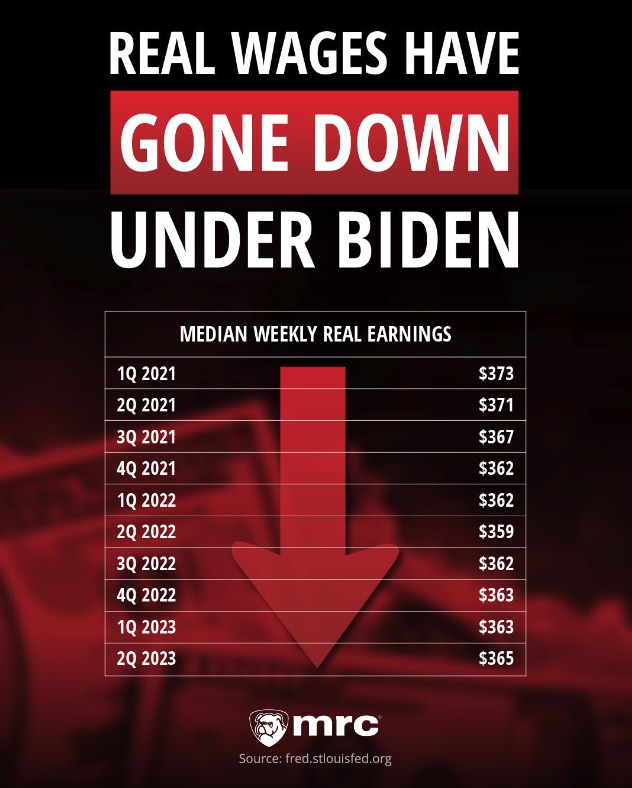
When adjusted for inflation, real wages earned by Americans have seen a decline under President Biden. In the first quarter of 2021, the median weekly real earnings averaged $373. By the second quarter of this year, this figure had fallen to $365.
Under President Trump, real wages increased from $352 on January 1, 2017, to $373 on January 1, 2021.
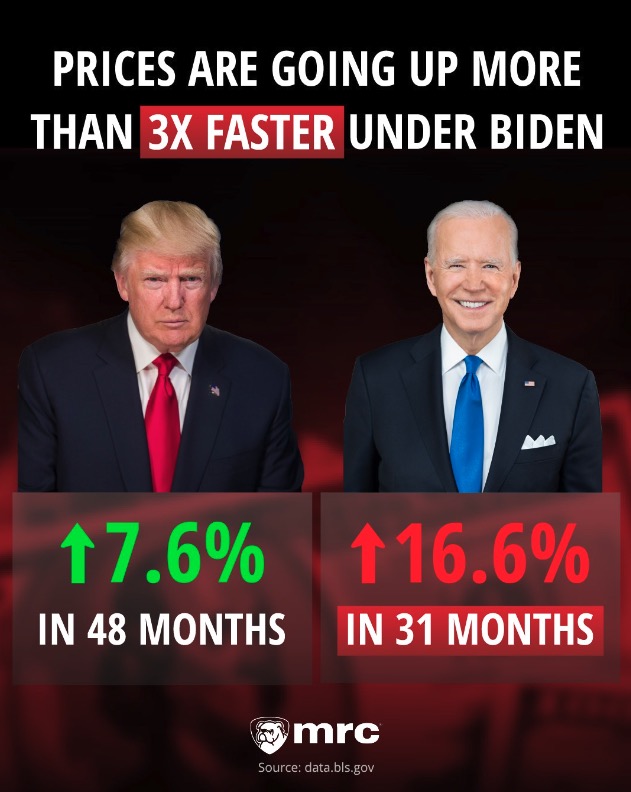
Consumer prices also tell a telling tale. During the 48 months of the Trump Administration, consumer prices increased by 7.6%, as indicated by the Consumer Price Index (CPI). In contrast, in just 31 months under President Biden, prices have risen by a whopping 16.6%.
The CPI has climbed from 262.650 in January 2021 to 306.269 in August 2023, putting it on track to increase more than three times as much as it did during Trump’s entire four-year term.
The cost of financing a home purchase has significantly risen during the Biden Administration.
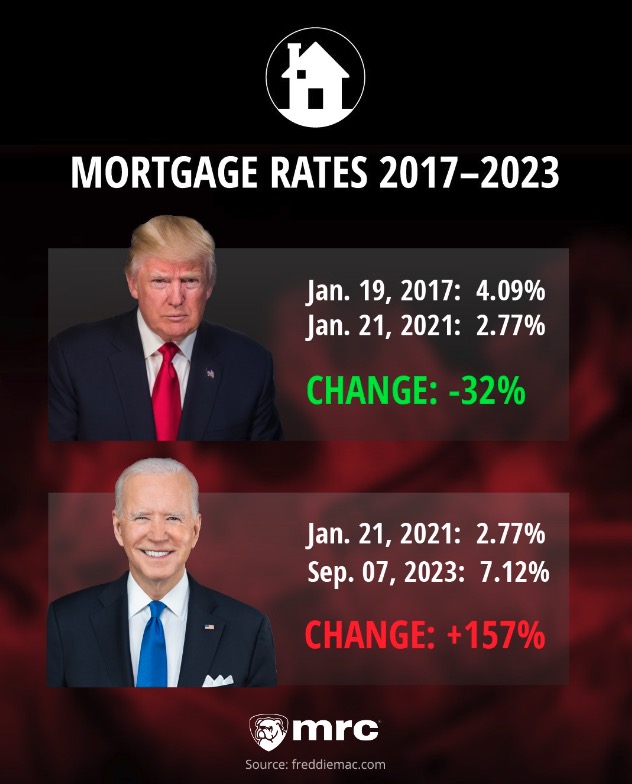
Mortgage rates today are more than double the average rates home buyers paid when Trump left office. Under Biden’s predecessor, the average 30-year fixed mortgage rate dropped by a third, going from 4.09% to 2.77%. However, by September 7, 2023, mortgage rates had more than doubled, surging by over four percentage points to reach 7.12%.
With Americans earning less and facing higher costs, their average savings rate has dwindled under Biden.
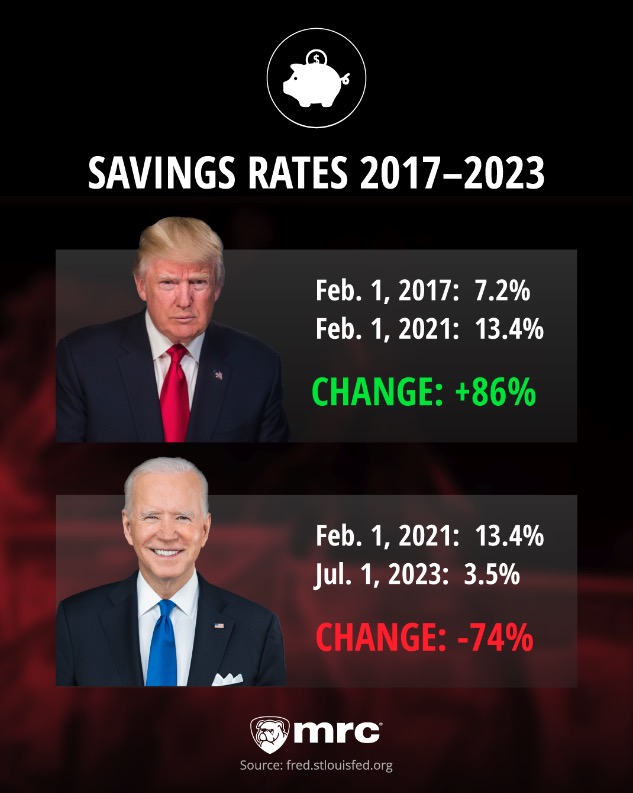
From February 1, 2017, to February 1, 2021, the average personal savings rate shot up by 86%, from 7.2% to 13.4%. Yet, by July 1 of the current year, it had plummeted to a mere 3.5%, a quarter of its pre-Biden level, based on calculations incorporating data from the Federal Reserve Bank of St. Louis (FRED) and the Bureau of Labor Statistics.
Under the Biden administration we’ve seen rising gas prices, declining real wages, soaring consumer prices, increased mortgage rates, and a drop in the average savings rate.